

Data
09 August 2024
Social, economic, and ecological status of tourist destinations in the Flanders region
Data
09 August 2024
Login / create an account to be able to react
-
41
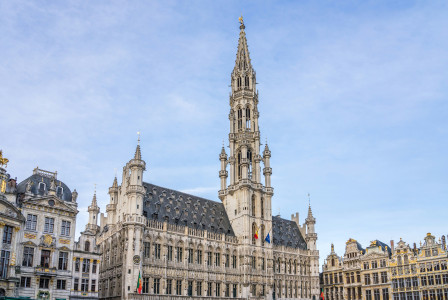
Tourism Flanders provides a comprehensive and regularly updated statistical dashboard, offering profound insights into the tourism indicators, trends and impacts in the Flanders region.
Visit Flanders
Topics
Belgium
Academic / Research and VET Institutions
Company with 250 or more employees
Consumer Organisations
Cultural and Heritage Organisations
Destination Management & Marketing Organisations
EU Institutions
Financial Institutions and Investors
Industry Associations and Chambers of Commerce
International Organisations
Local Authorities
Media / Journalist Organisations
National authorities
Networks and Federations / Confederations
NGOs / Non-profits
Regional Authorities
SMEs (a company with less than 250 employees)
Trade Unions
-
Specific types of tourism
-
-
Adventure tourism
-
Coastal, maritime and inland water tourism
-
Cultural tourism
-
Ecotourism
-
Education tourism
-
Festival tourism
-
Gastronomy tourism
-
Health and medical tourism
-
MICE tourism
-
Mountain tourism
-
Religious tourism
-
Rural tourism
-
Sports tourism
-
Urban/city tourism
-
Wellness tourism
-
-
Transition Pathway Strategic Areas
-
-
Coordinated information on travelling
-
Improving statistics and indicators
-
Innovative tourism services
-
-
Business activities
-
-
Activities of amusement parks and theme parks
-
Activities of associations and other organisations supporting tourism
-
Air passenger transport
-
Camping grounds, recreational vehicle parks and trailer parks
-
Events catering and other food services
-
Festivals, cultural and entertainment activities
-
Gardens and nature reserves activities
-
Holiday Housing / Apartments and other short stay accommodation
-
Hotel and similar accommodation
-
Mobile beverage services
-
Mobile food services
-
Museums
-
Operation of historical sites
-
Other
-
Other accommodation
-
Other amusement and recreation activities
-
Other food and beverage services
-
Other holiday reservation services
-
Other tourism transportation activities
-
Rail Passenger transport
-
Recreational and sport activities
-
Restaurants, cafes and bars (Food and Beverage serving activities)
-
Road passenger transport
-
Tour operator activities
-
Travel agency activities
-
Water (sea, coastal and inland) passenger transport
-
Share
In 2022, the Flemish region saw a visitor intensity of 1.8 tourists per 100 inhabitants, the highest level since data became available in 2015. Maaseik city recorded the highest visitor intensity in the region, with 133.8 tourists per 100 inhabitants. Despite the high influx of tourists, the majority of residents view tourism and its impact positively, although they do acknowledge some negative effects. For more comprehensive data, Toerisme Vlaanderen provides a free statistical dashboard that is automatically updated. This dashboard allows exploration of various indicators such as visitor and resident satisfaction with different aspects of tourism, the number of active companies, employment status in the industry, and the influence of tourism on destinations. It compiles available indicators and their evolutions to enhance understanding of the state of tourism in Flanders. (The original piece available only in Dutch)
#Tourism indicators
Comments (0)
Connected Partnership Opportunities
See also

Intra-EU tourism 2022: Trends and recovery
- Categories
- Coastal, maritime and inland water tourism Cultural tourism Ecotourism +40 meer

Tourism receipts and spending 2008-2018
- Categories
- Coastal, maritime and inland water tourism Cultural tourism Ecotourism +40 meer

Flanders’ tourism employment
- Categories
- Coastal, maritime and inland water tourism Cultural tourism Ecotourism +40 meer